What got through, and can I trust it?
Back to the playbook · Measurement instructions for your AI · Aggregate data · October aggregates
Updated November 2, 2026. October 2026 is complete and is the month I benchmark later months against; its section comes first. The task audit after it keeps its own window, October 1–19, Vancouver time, ending at midnight on October 20. Earlier cost studies and snapshots retain their own dates.
October 2026, the benchmark month
October is the first complete month of the new pipeline. The counts below cover October 1–31, Vancouver time, collected on November 2. Every line keeps its lens. None of them is the 20× measure, which stays accepted parent tasks per developer-week and is still unmeasured. October is a benchmark of how far the system can be pushed, not a monthly run-rate: later months will vary with travel and other work, and I will publish new figures when a month beats this one.
| October 1–31, 2026 | Value | What it is, and what it is not |
|---|---|---|
| Merged PRs a week against DX's median daily Cursor user (4.1) | 16.0× at September's PR size; 16.1× by code lines | PR volume against a dated external cohort, per developer (my own account), normalized for the October packaging change. Not productivity. As counted it reads 118.7×, which I do not use: the median merged PR fell from 788 lines in September to 139. |
| April–September, same benchmark | 4.8–8.8× a month; about 7.2× on average | One workflow, so those months compare with each other |
| Activity per calendar day against the April–September average | 3.0× (non-merge commits 3.03×, code lines 3.04×) | Measures the packaging cannot inflate. Against September alone, 1.8×. Activity, not accepted work |
| PRs authored by my account | 2,269 opened; 2,155 merged; 58 closed unmerged | Includes agent work authored under my account. 1,047 of the merges went into internal task branches |
| Board tasks finished | 895, with 55 epics counted apart | Status done on our board. Done is not independent acceptance |
| Board tasks filed | 1,444, including 545 on October 29; 544 open at month end | The backlog grew faster than it closed. October 29 is the day the November backlog was drafted and filed |
| Lead time, filed to done | Median 2.6 days; 85% within 8.8 days | 894 finished tasks with a filed date. Includes queues and waits |
| PR time to merge | Median about 15 minutes; 85% within 3.4 hours | Creation to merge. About half merged into internal task branches through the pipeline's own gate, so this is pipeline latency, not a person's review wait |
| First-attempt acceptance | 72% (471 of 656) | Finished tasks with runner ledger rows that needed one worker attempt and no fix round. Tasks without ledger rows are left out, not counted as passes |
| Model usage at list prices | $11,168 on $300 of monthly subscriptions ($200 Claude, $100 Codex) | API-equivalent at the dashboard's configured prices, not an invoice. Excludes infrastructure. The headless runner used about 21% of it |
| All usage per finished task | $12.48 | Every kind of usage, coordination and interactive sessions included, divided by finished tasks |
| Runner cost per finished task | Mean $1.06; median $0.65 (656 tasks) | Worker and brief preparation only, failed attempts included. Reviews, coordination and interactive sessions are not attributed. Do not compare it with the line above |
Why I report 16× and not 119×. PR counts flatter a pipeline that opens one PR per task and merges repairs into task branches. I normalized two independent ways, by the rise in non-merge commits and by the rise in code lines, and both land at 16×. The packaging section shows the shift.
What stands behind the merges. The backend repository declares more than 20,000 test cases (a count of it( and test( calls in test files on October 31, not a CI run count). Changes also go through API tests, a peer reviewer and an independent deep review, and agents test the product through the UI and as an MCP and SDK client. Not every change passed every layer: in the October 1–19 audit below, 213 of 275 merged units were reviewed with passing tests, and the first deep review blocked about 1 in 5. That audit was not rerun for the full month. A security audit and hardening started in October and are still open.
Decision wait is a snapshot. On November 2, 30 tasks waited on a person, a median of about 4.7 days in that state (oldest 19.5). That describes the queue at one moment, not October. Only five decisions so far carry both asked and answered times, so the closed decision wait is not measured yet.
What the month depends on. A number like this depends on where a product is in its life. We built many new features in October, which makes tasks plentiful. It is the benchmark I measure myself against, not a verdict on any other team. Definitions, percentile rules and the collection time are in the October aggregates.
Read the results in three questions
These come from the October 1–19 task audit.
What work got through? 185 work items have every recorded part merged. Across the full cohort, 275 implementation units merged. A work item is the requested outcome; an implementation unit is a part of that work. A PR carries code changes and can be a repair. These counts describe different levels and must not be added together. The source records do not yet reliably distinguish accepted bug fixes from accepted feature slices.
Can I trust those changes? Of the 275 merged units, 213 are classified as reviewed with passing tests: 146 with deep review and 67 with standard review. The remaining 62 have different or incomplete evidence. 14 of those carry specific audit flags. This is evidence coverage, not certification that every original requirement works; the classifier's limits are below.
What did it cost? Recorded pipeline usage was $1,065.06, or $3.87 per merged implementation unit, including unfinished attempts and unmatched usage. This excludes the coordinator, human time and infrastructure, and prices model usage at API-equivalent rates. Full cost per independently accepted outcome is still unknown.
These are the headline results. Repair counts, review rounds and elapsed times below help explain where the process needs improvement; they are supporting diagnostics.
What I mean by done
For each outcome I want evidence for: requirement defined → implemented → behavior verified → review findings resolved → integrated → accepted. A change counts only as far as the evidence supports. The current audit establishes integration and some verification evidence; independent acceptance remains unreconciled.
For a bug fix, the useful evidence is the original failure, a test or reproduction showing the fix, relevant regression checks and review of the final change. For a feature slice, it is the requested behavior demonstrated against its acceptance criteria. The review practice explains the checks. Team memory connects the task, criteria, decision, revision and verification references so the next person can inspect them.
Keep work size separate from work completed
For future comparisons I want the work classified before execution: a small change to one behavior, a change spanning several components, or a larger change involving interfaces, migration or rollout risk. Compare bug fixes with bug fixes and feature slices with similar feature slices. The current audit has no reliable size or work-class labels, so it cannot report a number of equivalent bugs or features.
Lines changed can describe the code footprint. An estimate of equivalent human effort needs actual baseline examples with comparable scope and verification; I will not assign hours to a task after seeing how many lines an agent produced. Features and epics group outcomes. Per-developer results require an explicit human-effort denominator.
Why I call it The 20× Developer Playbook
I built a system that lets me define work with agents, share decisions and context through governed team memory, run focused workers, and bring changes back through review and integration. My account recorded 770 merged PRs in October 12–18. The scale of execution has changed enough that PRs alone no longer explain what the system delivers.
20× is my target for repeatable software delivery capacity per developer: comparable accepted parent tasks per developer-week against a stated baseline, with human effort, quality and total cost reported alongside it. The title gives the work a direction as I bring more developers into the workflow. It is not a mathematical discount applied to the PR ratio, a guaranteed result, or an isolated claim about memory.
The eventual calculation is (accepted parent tasks / developer-weeks with the system) / (accepted parent tasks / developer-weeks in the baseline). Keep work categories and complexity comparable, set acceptance before execution, and include the human effort of everyone preparing, reviewing and integrating the work. Human minutes per accepted task provide a second check on the result. For illustration only, 100 comparable accepted tasks per developer-week against a baseline of five would establish 20× on that measure. Those are not my measured task counts.
The PR benchmark, with its counting rules
DX's January 2026 report reports a median of 4.1 merged PRs per week for daily Cursor users.
| October 12–18 | Observed count | Raw ratio to 4.1/week |
|---|---|---|
| All merged PRs authored by my account | 770 | 187.8× |
| Merges into internal task branches | 462 | Included in the total above |
| Merges into other branches | 308 | 75.1× |
Using the rounded reference of four gives 770 / 4 = 192.5×. These are PR-volume ratios against a dated external cohort. The other branches include integration and release branches; the 308 are not independently accepted features or verified production deployments. October 1–19 contains 1,026 authored PRs and 972 merges; the complete month, 2,269 and 2,155. Creation and merge dates are separate series, so their ratio is not a success rate.
DX's throughput documentation normalizes by contributing engineers and excludes bot-authored PRs. My count includes agent work authored under my account. Task size, work mix, automation, human contributors and counting rules need alignment before interpreting a comparison as productivity. This one week is an observed result, not a forecast or a sustained average. The next section puts the same benchmark across a full year, with October adjusted for PR size.
A year against the DX benchmark
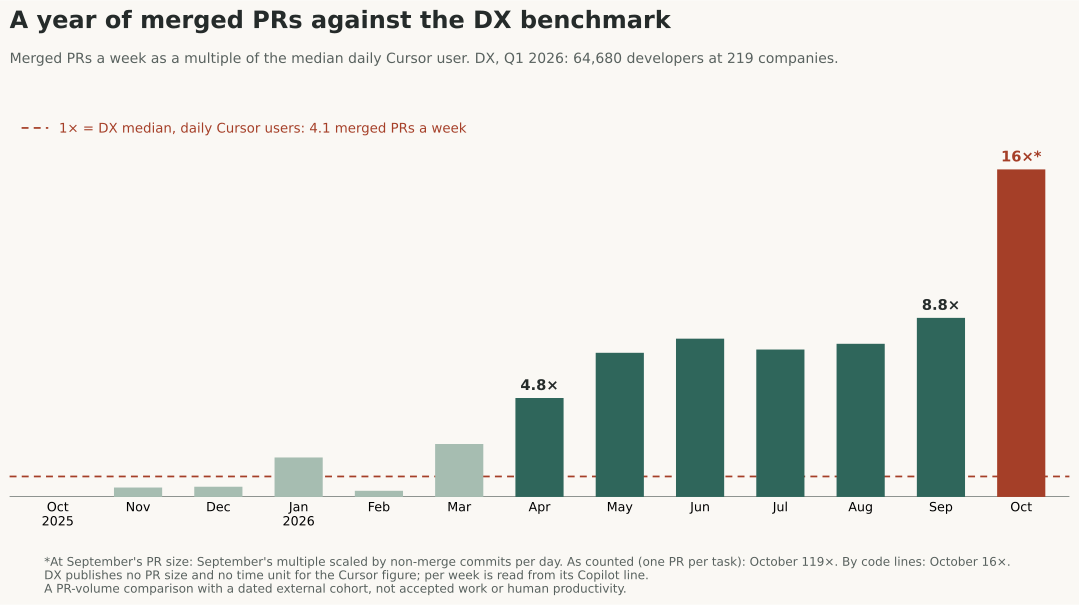
Each bar is merged PRs per calendar day × 7, divided by DX's 4.1. From April, when I moved to parallel sessions with guardrails, the multiple ran 4.8× and climbed to 8.8× in September. April through September averages about 7.2×. Those months used one workflow, so the PRs are comparable with each other.
October is not comparable as counted. The pipeline now opens one PR per task unit and merges repairs into task branches, so merged PRs per day rose 13.6× from September while non-merge commits rose 1.83×. As counted, October reads 119×. At September's PR size (September's multiple scaled by the rise in non-merge commits per day) it reads 16.0×; scaled by code lines instead, 16.1×. The chart shows 16.0×, the lower of the two size-adjusted readings. October is complete; the chart is regenerated from the data, never from a projection.
What DX defines and what it leaves open. The Q1 2026 report covers 64,680 developers at 219 companies; daily Cursor users rose from 2.8 merged PRs in Q4 2025 to 4.1. DX's throughput is merged PRs divided by contributing engineers, an engineer counts once they have merged at least one PR, and bot-authored PRs are excluded. My count is GitHub author hataheri only, one contributing engineer, so the denominator matches. Two things DX does not publish: a PR size, and a time unit for the Cursor figure. I read it as per week because the same report states its Copilot figure per week. Without a published size, no comparison can be one-to-one on PR size; the size adjustment above aligns October with my own September, not with DX's cohort.
Lines per merged PR, as an upper bound. September had about 2,130 code lines (3,297 with tests) per merged PR; October, 289 (470). These sum every non-generated commit diff on all reachable refs, including work that never went through a PR and superseded branch work, so they overstate a PR's final diff. Earlier months show this clearly: February reads 38,669 code lines per merged PR because most work then landed without PRs. Treat these as an upper bound and as evidence of the October packaging change, not as proof that my PRs are larger than DX's. GitHub's own size per merged PR (additions plus deletions, all files) is now collected: the median merged PR was 788 lines in September and 139 in October. That drop is what the size adjustment corrects for. A release PR from an integration branch carries the work it integrates again, so medians are the safer summary.
The multiple is a PR-volume comparison with a dated external cohort. It is not accepted work, human productivity or the 20× measure, which remains accepted parent tasks per developer-week. The monthly values, lines per PR and both October readings are in the benchmark block of the monthly activity data.
How much more work happened in October
Merged PRs per calendar day rose about 13.6× from September to October. Commits did not follow. The pipeline changed how work is packaged: each task unit gets its own PR, repair PRs merge into internal task branches, and integration adds merge commits. Those changes multiply PR and merge counts without multiplying the work, so I compare the months on measures that keep one meaning across both workflows.
| Per calendar day | April–September average | September | October | October vs September | October vs April–September |
|---|---|---|---|---|---|
| Merged PRs | 4.21 | 5.13 | 69.52 | 13.55× | 16.53× |
| All commits, including merges | 52.04 | 85.63 | 212.81 | 2.49× | 4.09× |
| Non-merge commits | 46.21 | 76.57 | 139.94 | 1.83× | 3.03× |
| Code lines changed | 6,615 | 10,936 | 20,084 | 1.84× | 3.04× |
| Test lines changed | 2,765 | 5,990 | 12,569 | 2.10× | 4.55× |
| New design specs | 1.39 | 1.63 | 2.71 | 1.66× | 1.94× |
All months are complete; October has 31 observed days.
The packaging shift shows directly. In September there were 14.92 non-merge commits per merged PR; in October, 2.01. Of October's 2,155 merged PRs, 1,047 merged into task branches, 1,071 into integration and release branches and 37 into default branches. Merge commits rose from 10.6% of all commits to 34.2%.
On the measures the repackaging cannot inflate, October's activity per calendar day is about 1.8× September's and 3.0× the April–September average, not 13.6×. That is a large step on top of September, which already had the most non-merge commits of any earlier month. It is still an activity ratio, not a productivity multiplier. Lines describe the code footprint an agent produced; they are not human effort, value or accepted work, and the rule above against assigning hours from lines still holds. Test lines grew faster than code lines. New specs rose; plan documents fell from 3.33 to 1.42 a day. I have not checked how much planning moved into the pipeline's own task briefs, so design-document counts are a weak signal across this change. The 20× measure remains accepted parent tasks per developer-week.
Scope and limits: commits by author names hataheri or Hamed Taheri across the local repositories scanned (40, of which 33 have commits by these authors; one could not be read in this refresh), all reachable refs without a fetch, so unmerged and superseded branch work is included. Hashes are deduplicated; line totals also drop rebased copies of the same change. Lockfiles, build output and binaries are excluded; test lines are paths in test folders or named *.test.* and *.spec.*. Data and configuration files swing by millions of lines in some months and stay out of the comparison. Merged PRs come from GitHub search for author hataheri by merge date. The observed period is not a forecast.
The monthly activity data covers October 2025 through October 2026 and contains no repository names or PR links. To refresh it from the source repository:
python scripts/playbook-activity.py --output Docs/engineering-productivity-handbook/v0.2.0/evidence/activity-history.json
cd Docs/engineering-productivity-handbook/v0.2.0 && python build.py
Add --skip-github to measure local Git only. The script reads history without fetching or writing to any repository, paces GitHub searches and caches settled weeks outside the repository.
Calculation details
The deduplicated runner ledgers cover 457 task units grouped into 308 parent tasks, across five repositories; 406 units belong to one TypeScript backend. This is a subset of account-wide activity. Fix-worker runs belong to the unit they repair. Feature parts remain separate units; parent completeness covers the parts recorded in these ledgers.
| Measure | Calculated result | What the result means |
|---|---|---|
| Task units merged | 275 / 457 (60.2%) | Observed cohort merge share; 266 direct integrations and nine stacked units whose parent landed. Remaining units are not necessarily failures. |
| Parent tasks with all recorded parts merged | 185 / 308 (60.1%) | Count each parent once; 28 more parents have some parts merged and 95 have none merged. |
| Units with a PR and a recorded repair worker | 116 / 307 (37.8%) | Recorded repair incidence; fixes made manually or by other paths may be absent. |
| Merged units without a recorded repair worker | 172 / 275 (62.5%) | An observable proxy; it does not establish first-pass acceptance or no human intervention. |
| Own-PR review rounds | Median 1; p90 6; maximum 20 | Distinct reviewed head revisions for each of 307 units with a PR. Repair-PR reviews are separate. |
| First ordinary review with unconditional MERGE | 38 / 307 (12.4%) | Another 268 (87.3%) received MERGE AFTER; conditional approval is not completed acceptance. |
| First deep review with DO NOT MERGE | 40 / 201 (19.9%) | A stronger review found blocking issues in roughly one in five reviewed units. Across all rounds, 60 units received at least one DO NOT MERGE. |
| Merged units classified as deep review plus passing tests | 146 / 275 (53.1%) | Another 67 have standard review plus passing tests. Review coverage is not production quality. |
| Merged units flagged by the review/test classifier | 14 / 275 (5.1%) | Seven CI-failure classifications, six with additional commits after review, one override. Another 35 have conditions changed without later review. |
| First logged activity to own-PR merge | Median 2.17 hours; p90 13.30 hours | 266 directly merged units. Includes queues and waits. Nine stacked units excluded because their own merge precedes the parent's landing. |
| Recorded usage attributed to merged units | Median $1.37; mean $2.35; p90 $5.19; maximum $19.65 | API-equivalent pipeline usage per merged unit; coordinator excluded. |
| All recorded pipeline usage / merged units | $1,065.06 / 275 = $3.87 | Includes unfinished work and $79.21 in unattributed usage; still excludes coordination, unpriced activity, infrastructure and human labor. |
The elapsed-time figure begins at the first retained activity event, not necessarily task creation or the start of preparation. It ends at integration, not production or acceptance. All 266 direct intervals are non-negative and have both timestamps. The cohort remains right-censored: work still open can finish later, and timing statistics over completed units omit those slower unfinished cases.
The review/test classes come from the existing audit classifier. GitHub's final-head CI rollup was retrieved live; it does not reconstruct the check state at the historical merge instant. These are flags for investigation, not 14 confirmed customer defects. Reviews of a repair PR cover its diff, not automatically the combined final change. The earlier review audit retains its historical 272-unit snapshot and hand-check findings; the numbers above are the refreshed 275-unit view.
All dollar amounts are API-equivalent estimates recorded by the CLI, not invoices or software value. The $3.87 ratio keeps the whole measured pipeline numerator, whereas the $1.37 median describes only usage attributed to merged units. Neither establishes full cost per accepted task. The earlier coordinator-inclusive studies remain in the cost reference.
What my own answers showed
Agents ask me multiple-choice questions when they need a call. I studied 1,109 of them, asked across 48 sessions from September 15 to October 30, 2026.
| What I answered | Share |
|---|---|
| Took the agent's recommended option | 76% |
| Picked another listed option | 17% |
| Typed my own answer | 7% |
I hand-labeled half of the 230 answers where I changed course, so these shares are estimates. About 40% went bigger or sooner: fix it now instead of deferring, keep everything in scope, one more round. About 16% were product, UX or pricing direction, and about 11% went smaller or later. About 10% said "check it yourself, don't ask", and about 8% corrected a stale fact the session believed. Budget changes always went up.
Three things followed. The recommendations leaned too cautious: I went bigger about four times as often as smaller. The questions only I could answer, product direction and doing less, were roughly 6–7% of all questions, and they came up mostly while an epic or spec was being planned, not mid-build. And many "ask the person" stops were really "is this true?" questions the system could answer by running a check. That is the basis of the decision classes in Agentic Kanban, which are still a design.
These numbers describe one person's answers in one period. Another person, product stage or task mix will differ.
Which proposed metrics still need data
| Proposed metric | What existing data supports | What is still missing |
|---|---|---|
| Accepted tasks per developer-week | Merge identities, parent groups and some board completion records | Independent acceptance reconciliation and actual human contributor/time denominator |
| First-pass acceptance | Repair-worker and review histories above | Acceptance event, first-attempt identity and complete manual rework history |
| Autonomous completion and interventions | Pipeline stop/needs-human outcomes in dated cohorts | Complete intervention events and consistent eligibility/attempt denominator |
| Unattended delivery | An earlier October 16–19 run landed 81 integration PRs | Developer-away intervals; that run included human drop-ins, so 81 is not a no-human completion count |
| Handoff success | Session handoffs and shared records exist | Explicit transfer, resumed outcome and whether human rebriefing was needed |
| Time to first accepted contribution | Some session and merge timestamps | Developer onboarding start and first verified acceptance |
| Repeated mistakes and duplicate work | Selected incident notes and task links | Consistent error/overlap labels and an eligible-task denominator |
| 30-day delivery durability | Merge timestamps | A mature 30-day follow-up period for this October cohort and attributable reopen/revert/defect links |
| Customer impact | Delivered-work references in selected cases | Feature adoption or customer outcome measurements joined to the work |
| Production DORA measures | Integration events and some CI evidence | Consistent production deployments, incidents, rollbacks and recovery links per service |
| Memory's isolated contribution | Memory, preparation, execution and review changed together | A matched comparison holding other factors reasonably constant |
Unknown values remain unknown; they do not become zero interventions, perfect handoffs or failed deliveries. Session gaps and automated user-role messages do not measure a person's active time.
How I use established measures
The Kanban Guide uses throughput, cycle time, work in progress and work-item age with explicit start/finish definitions. Here I can report merge throughput and a recorded-activity-to-merge timing proxy. Calling every unmerged unit active WIP would overstate what the ledgers show.
DORA measures production change lead time, deployment frequency, failed deployment recovery time, change fail rate and deployment rework rate. An integration PR or successful CI run cannot substitute for a production deployment. Those measures belong in the next instrumentation pass, per service.
For our team, I want accepted parent tasks per developer-week and human minutes per accepted task at the center, with repair, durability, cycle time and full cost beside them. Team memory should make accepted outcomes, decisions, handoffs and evidence easier to connect. The current calculations establish what our execution records show; the next measurements test how much of that becomes repeatable accepted delivery as more developers join.
Reproduction and scope
Private inputs are local preparation/worker/repair/review ledgers and authenticated GitHub metadata. REST PR searches were partitioned by day and checked for complete pagination and duplicate IDs; an independent GraphQL query checked all 972 merged PRs and their destinations. The public JSON contains aggregate counts, formulas, distributions, exclusions and the null accepted-delivery multiplier. Raw task names, PR links, repository breakdowns and transcripts are excluded from the download.
The source repository's scripts/playbook-metrics.py computes these aggregates from the private audit snapshots; scripts/playbook-activity.py recomputes the monthly activity series from local Git and GitHub. Timing p90 uses the nearest indexed value at round(0.9 × (n − 1)) in ascending order. Rounding is for display; the underlying ratios use the unrounded counts.